Correlation and
Simple Regression Example
Calculations by Professor S. Gramlich
Updated 3/23/09
10-2 and 10-3 #14 (from Triola, “Elementary Statistics,” 10th ed, C2006, pp. 535, 554)
Song Audiences and Sales
The table below lists the numbers of audience impressions (in hundreds of millions) listening to songs
and the corresponding numbers of albums sold (in hundreds of thousands). The number of audience
impressions is a count of the number of times people have heard the song. The table is based on
data from USA Today. Does it appear that album sales are affected very strongly by the number
of audience impressions? Find the best predicted number of albums sold for a song with
20 (hundred million) audience impressions.
|
Audiencee Impressionss |
28 |
13 |
14 |
24 |
20 |
18 |
14 |
24 |
17 |
|
Albums Sold |
19 |
7 |
7 |
20 |
6 |
4 |
5 |
25 |
12 |
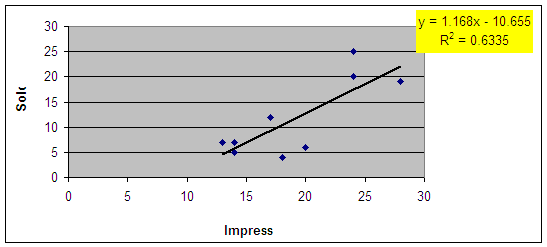
Scatterplot
Sample Stats
mean for x
xbar = Σx / n = (28 + 13 +...+ 24 + 17) / 9 = 19.1
standard deviation for x
sx = √[Σ(x-xbar)2 / (n-1)] = √[(28-19.1)2 + (13-19.1)2 +...+ (17-19.1)2] / (9-1)
= √[SSx / (n-1)] = √[222.9/8] = 5.278
mean for y
ybar = Σy / n = (19 + 7 +...+ 12)/ 9 = 11.7
standard deviation for y
sy = √[Σ(y-ybar)2 / (n-1)] = √[(19-11.7)2 + (7-11.7)2 +...+ (11-11.7)2] / (9-1)
= √[SSy / (n-1)] = √[480/8] = 7.746
covariance
sxy = Σ(x-xbar)(y-ybar) / (n-1) = (28-19.1)(19-11.7) + (13-19.1)(7-11.7) +...+(17-19.1)(11-11.7)
= SSxy / (n-1) = 260.3/8 = 32.542
Correlation
r = sxy / (sxsy) = 32.542/(5.278*7.746) = .796
OR
= SSxy / √[SSxSSy] = 260.3 / √[222.9*480] = .796
r Critical value
from Table A-6: n=9, α = 0.05, rc = ±.666
Conclusion:
(critical region in red, p-value region in blue)
_________________________ Since r inside critical region, Reject H0.
| | | There appears to be a significant linear relationship
-.666 +.666 .796 between # of audience impressions and # of albums sold.
(also from Table A-6, .796 in between .666 and .798, so .05 > P-val > .01, Reject H0)
10-3 #14
Slope
b1 = SSxy / SSx = 260.3 / 222.9 = 1.168
b0 = ybar - b1
* xbar = 11.7 - 1.168 *
19.1 = -10.655
Yhat = b0 + b1X = -10.655 + 1.168X
Yhat (20) = -10.655 + 1.168*20 = 12.7