MULTIPLE
CHOICE. Choose the one alternative that
best completes the statement or answers the question.
Solve
the system using an appropriate method. If a system has an infinite number of
solutions, use set-builder notation to write the solution set. If a system has no solution, state this.
1) ![]() x
x ![]() y =
y = ![]()
![]() x
x ![]() y =
y = ![]()
A) No
solution
B) (![]() ,
, ![]() )
)
C) (![]() ,
, ![]() )
)
D) (![]() ,
, ![]() )
)
2) ![]() x - 2y
=
x - 2y
= ![]()
![]() x -
x - ![]() y =
y = ![]()
A) (1, 0)
B) (0, ![]() )
)
C) No
solution
D) (1, ![]() )
)
3) ![]() x +
x + ![]() y =
y = ![]()
![]() x +
x + ![]() y =
y = ![]()
A) No
solution
B) ![]() for any real number y
for any real number y
C) ![]()
D) ![]()
Solve
the problem.
4) Given the cost and revenue functions below,
find the break-even quantity.
C(x) = ![]() x
x ![]()
R(x) = ![]() x
x
A) ![]()
B) ![]()
C) ![]()
D) ![]()
5) Find the profit function given the cost and
revenue functions below.
R(x) = ![]() x
x
C(x) = ![]() x
x ![]()
A) P(x) = ![]() x
x ![]()
B) P(x) = ![]()
![]() x
x
C) P(x) = ![]() x
x
D) P(x) = ![]() x
x ![]()
Graph
the specified functions.
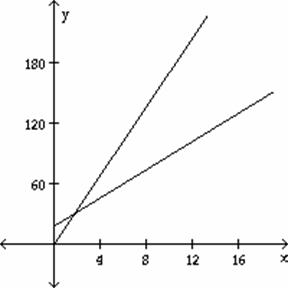
6) Producing x units of an item costs C(x) = ![]() x
x ![]() dollars.
dollars.
The revenue
from the sale of x of the items is R(x) = ![]() x
dollars.
x
dollars.
Graph the
cost and revenue functions on the same axes.
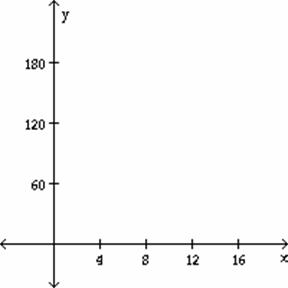
A)

B)
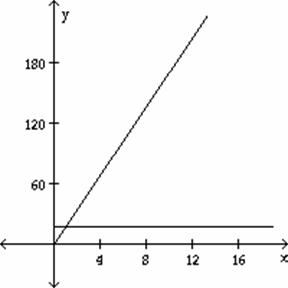
C)
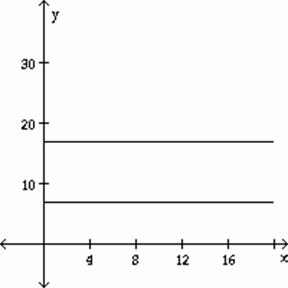
D)
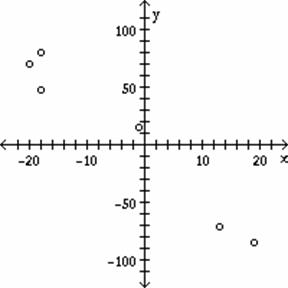
Plot a
scatter diagram for the given data points.
7) x: ![]()
![]()
![]()
![]()
![]()
![]()
y: ![]()
![]()
![]()
![]()
![]()
![]()
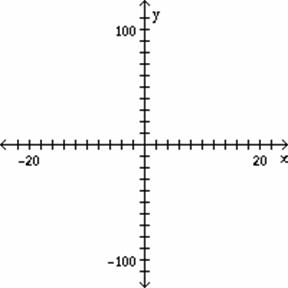
A)
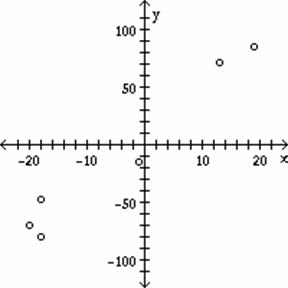
B)
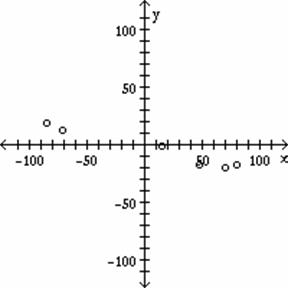
C)
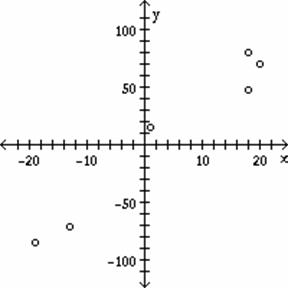
D)
Find the
least squares regression line for the
given data points. Round the final values to the neasrest hundredth.
8) ![]()
A) y =
0.75x + 4.07
B) y =
0.85x + 3.07
C) y =
0.75x + 5.07
D) y =
0.95x + 3.07
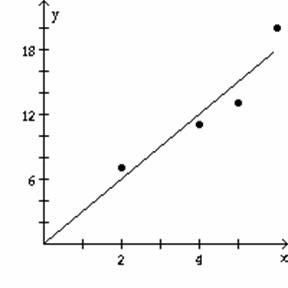
A set of
data points is given together with the equation of the regression line. Graph
the regression equation and the scatter plot on the same axes.
9) ![]()
Equation of
regression line: y = 3.0x
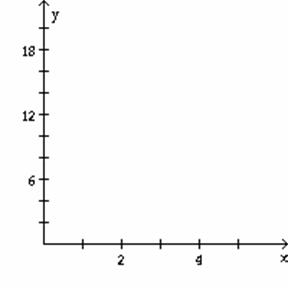
A)
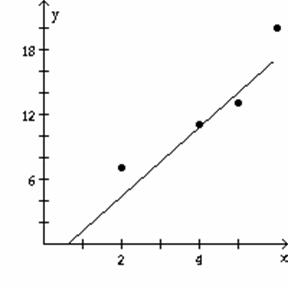
B)
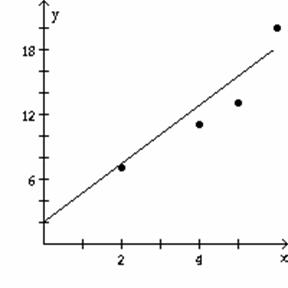
C)
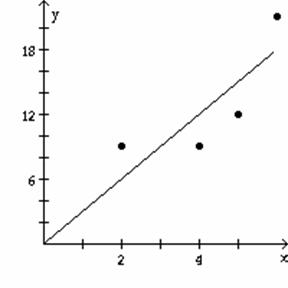
D)
Determine
whether you think that the correlation between the variables would be rather
low or rather high. Also say whether you think the correlation coefficient
would be positive or negative. Give an estimate of what you think the correlation
coefficient would be.
10) The hours of training each week of athletes
and their time to run 100 meters
A) High and
positive, 0.8
B) Close to
zero
C) Low and
positive, 0.3
D) High and
negative, -0.7
Compute
r, the coefficient of correlation for the given data points.
11) ![]()
A) ![]()
B) 0
C) ![]()
D) ![]()
Use the
given data to find the least squares regression line. Round the final values to three significant
digits, if necessary.
12) In the table below, x represents the number
of years since 2000 and y represents the population (in thousands) of the town
Boomville. Find the least squares
regression line which can be used to predict the population of Boomville (in
thousands) in any given year.
![]()
A) y = 25x
- 5
B) y = 12x
+ 20
C) y = 28x
- 10
D) y = 18x
+ 8
Use the
least squares regression equation to predict the y-value corresponding to the
given x-value.
13) Eight pairs of data yield the regression
equation ![]() .
.
x represents
the number of hours that a student studies for a test and y represents their
score on the test. What score would be predicted for a student who studies ![]() hours for the test?
hours for the test?
A) 57.8
B) ![]()
C) ![]()
D) 71.125
MULTIPLE
CHOICE. Choose the one alternative that
best completes the statement or answers the question.
1) D
ID: FM3Yc1-5
1.4.2-5
Objective:
Solve Linear System of Two Equations
2) C
ID: FM3Yc1-5
1.4.2-8
Objective:
Solve Linear System of Two Equations
3) B
ID: FM3Yc1-5
1.4.2-10
Objective:
Solve Linear System of Two Equations
4) B
ID: FM3Yc1-5
1.4.4-5
Objective:
Find Break-Even Quantity/Point Given Cost and Revenue Functions
5) A
ID: FM3Yc1-5
1.4.5-1
Objective:
Find Profit Function Given Cost, Revenue Functions
6) D
ID: FM3Yc1-5
1.4.6-1
Objective:
Graph Cost, Revenue, Profit Functions
7) D
ID: FM3Yc1-5
1.5.1-2
Objective:
Plot Scatter Diagram
8) C
ID: FM3Yc1-5
1.5.2-4
Objective:
Find Regression Equation
9) D
ID: FM3Yc1-5
1.5.3-1
Objective:
Graph Regression Equation and Scatter Plot
10) D
ID: FM3Yc1-5
1.5.4-3
Objective:
Estimate Correlation
11) A
ID: FM3Yc1-5
1.5.5-2
Objective:
Find Coefficient of Correlation
12) A
ID: FM3Yc1-5
1.5.6-6
Objective:
Solve Apps: Find Regression Equation
13) C
ID: FM3Yc1-5
1.5.7-1
Objective:
Solve Apps: Use Regression Line to Make Prediction