MULTIPLE CHOICE. Choose the one
alternative that best completes the statement or answers the question.
Express the null hypothesis and the alternative hypothesis in symbolic
form. Use the correct symbol (m, p, s )for the indicated parameter.
1) A skeptical paranormal
researcher claims that the proportion of Americans that have seen a UFO, p, is
less than ![]() in every one thousand.
in every one thousand.
A) ![]() : p <
: p < ![]()
![]() : p \'B3
: p \'B3 ![]() B)
B) ![]() : p =
: p = ![]()
![]() : p >
: p > ![]() C)
C) ![]() : p >
: p > ![]()
![]() : p \'B2
: p \'B2 ![]() D)
D) ![]() : p =
: p = ![]()
![]() : p <
: p < ![]()
Formulate the indicated conclusion in nontechnical terms. Be sure to
address the original claim.
2) A skeptical paranormal
researcher claims that the proportion of Americans that have seen a UFO, p, is
less than ![]() in every ten thousand. Assuming that a
hypothesis test of the claim has been conducted and that the conclusion is
failure to reject the null hypothesis, state the conclusion in nontechnical
terms.
in every ten thousand. Assuming that a
hypothesis test of the claim has been conducted and that the conclusion is
failure to reject the null hypothesis, state the conclusion in nontechnical
terms.
A) There is not sufficient evidence to support the claim that the true
proportion is less than ![]() in ten thousand.
in ten thousand.
B) There is not sufficient evidence to support the claim that the true
proportion is greater than ![]() in ten thousand.
in ten thousand.
C) There is sufficient evidence to support the claim that the true
proportion is less than ![]() in ten thousand.
in ten thousand.
Assume that the data has a normal distribution and the number of
observations is greater than fifty. Find the critical z value used to test a
null hypothesis.
3) a = 0.08; ![]() is m
3.24
is m
3.24
A) 1.41 B)
\'B11.75 C) \'B11.41 D) 1.75
Find the value of the test statistic.
4) A claim is made that the
proportion of children who play sports is less than 0.5, and the sample
statistics include ![]() subjects with 30% saying that they play a
sport.
subjects with 30% saying that they play a
sport.
A) ![]() B)
B) ![]() C)
C) ![]() D)
D) ![]()
Find the P-value for the indicated hypothesis test. (Round off intermediate calculations to at
least 4 decimal places.)
5) A medical school
claims that more than 28% of its students plan to go into general practice. It
is found that among a random sample of 130 of the school's students, 32% of
them plan to go into general practice. Find the P-value for a test of the
school's claim.
A) 0.3078 B)
0.1635 C) 0.1539 D) 0.3461
Identify the null hypothesis, alternative hypothesis, test statistic,
P-value, conclusion about the null hypothesis, and final conclusion that
addresses the original claim.
6) A poll of 1,068
adult Americans reveals that 48% of the voters surveyed prefer the Democratic
candidate for the presidency. At the 0.05 level of significance, test the claim
that at least half of all voters prefer the Democrat.
A) z x > z c , Fail to reject null.
B) z x < z c , Fail to reject null.
C) z x < z c , Reject null.
D) z x > z c , Reject null.
E) *Not a choice* additional answer information:
![]() : p =
0.5.
: p =
0.5. ![]() : p <
0.5. Test statistic: z = -1.31. P-value: p = 0.0951.
: p <
0.5. Test statistic: z = -1.31. P-value: p = 0.0951.
Critical value: z = -1.645. Fail to reject null hypothesis.
There is not sufficient evidence to warrant rejection of the claim that at
least half of all voters prefer the Democrat.
Identify the null hypothesis H0 and the alternative hypothesis H1.
7) The manufacturer of a
refrigerator system for beer kegs produces refrigerators that are supposed to
maintain a true mean temperature, m, of ![]() eF, ideal for a certain
type of German pilsner. The owner of the brewery does not agree with the
refrigerator manufacturer, and claims he can prove that the true mean
temperature is incorrect.
eF, ideal for a certain
type of German pilsner. The owner of the brewery does not agree with the
refrigerator manufacturer, and claims he can prove that the true mean
temperature is incorrect.
A) H0: m ³ ![]() e
e
H1: m
< ![]() e B) H0: m ²
e B) H0: m ² ![]() e
e
H1: m
> ![]() e C) H0: m
e C) H0: m ![]() e
e
H1: m
= ![]() e D) H0: m =
e D) H0: m = ![]() e
e
H1: m
![]() e
e
Formulate the indicated conclusion in nontechnical terms. Be sure to
address the original claim.
8) The manufacturer of a
refrigerator system for beer kegs produces refrigerators that are supposed to
maintain a true mean temperature, m, of ![]() eF, ideal for a certain
type of German pilsner. The owner of the brewery does not agree with the
refrigerator manufacturer, and claims he can prove that the true mean
temperature is incorrect. Assuming that a hypothesis test of the claim has been
conducted and that the conclusion is to reject the null hypothesis, state the
conclusion in nontechnical terms.
eF, ideal for a certain
type of German pilsner. The owner of the brewery does not agree with the
refrigerator manufacturer, and claims he can prove that the true mean
temperature is incorrect. Assuming that a hypothesis test of the claim has been
conducted and that the conclusion is to reject the null hypothesis, state the
conclusion in nontechnical terms.
A) There is sufficient evidence to support the claim that the mean
temperature is equal to ![]() .
.
B) There is sufficient evidence to support the claim that the mean
temperature is different from ![]() .
.
Assume that a hypothesis test of the given claim will be conducted. Identify
the type I or type II error for the test.
9) The manufacturer of a
refrigerator system for beer kegs produces refrigerators that are supposed to
maintain a true mean temperature, m, of ![]() eF, ideal for a certain
type of German pilsner. The owner of the brewery does not agree with the
refrigerator manufacturer, and claims he can prove that the true mean
temperature is incorrect. Identify the type I error for the test.
eF, ideal for a certain
type of German pilsner. The owner of the brewery does not agree with the
refrigerator manufacturer, and claims he can prove that the true mean
temperature is incorrect. Identify the type I error for the test.
A) The error of rejecting the claim that the mean temperature equals ![]() eF when it is really
different from
eF when it is really
different from ![]() eF.
eF.
B) The error of rejecting the claim that the mean temperature equals ![]() eF when it really does
equal
eF when it really does
equal ![]() eF.
eF.
C) The error of failing to reject the claim that the mean temperature
equals ![]() eF when it is really
different from
eF when it is really
different from ![]() eF.
eF.
Find the critical t value or values for the given hypothesis, sample
size, and significance level.
10) H1: m 2.3
n = 6
a
= 0.01
A) \'B13.143 B)
\'B13.707 C) \'B13.365 D) \'B14.032
11) What is the P-value for
#10, given t x =
.049 ?
A) 0.10 B) 0.01 C) > 0.10 D) > 0.20
What decision rule should you use to test H0?
12) A consumer group
tests ten cars to see whether the automaker's claim that the cars get more than
![]() miles to the gallon is true.
miles to the gallon is true.
H0: m ²
![]() . Use a
5% significance level.
. Use a
5% significance level.
A) Reject H0 if
P-value of ![]() > 0.05.
> 0.05.
B) Reject H0 if ![]() > 1.645.
> 1.645.
C) Reject H0 if ![]() \'B1 1.96 s/
\'B1 1.96 s/![]() includes
x.
includes
x.
D) Reject H0 if ![]() > 1.833.
> 1.833.
Compute the value of an appropriate test statistic for the given
hypothesis test.
13) Given below are the weights (in pounds) of ten 35-year-old women who are following a certain exercise regimen. You wish to test the claim that the mean weight for all 35-year-old women following this exercise regimen is equal to 128 pounds. Compute the value of the appropriate test statistic.
142 128 116 154 109
125 132
129 166 148
A) t = 3.78
B) t = 0.39 C) t = 1.24 D) t = 0.12
Determine whether the hypothesis test involves a sampling distribution
of means that is a normal distribution, Student t distribution, or neither.
14) Claim: m = ![]() . Sample
data: n =
. Sample
data: n = ![]() ,
, ![]() =
= ![]() , s =
, s = ![]() . The
sample data appear to come from a normally distributed population with s =
. The
sample data appear to come from a normally distributed population with s = ![]() .
.
A) Student t B)
Neither C) Normal
Assume that a simple random sample has been selected from a normally
distributed population. Find the test statistic, P-value, critical value(s),
and state the final conclusion.
15) Test the claim
that for the population of female college students, the mean weight is given by
![]() Sample data are summarized as
Sample data are summarized as ![]()
![]() and
and ![]() Use a significance level of
Use a significance level of ![]()
A) P-Value > 0.1, Reject Null
B) P-Value \'B2 0.1, Reject Null
C) P-Value > 0.1, Fail to reject Null
D) P-Value < 0.1, Fail to reject Null
E) *Not a choice* additional answer information:
a = 0.1
Test statistic: t = 1.57
P-value = .1318
Because t < 1.729, we fail to reject the null hypothesis. There is not
sufficient evidence to warrant rejection of the claim that ![]()
Test the given claim using the traditional method of hypothesis testing.
Assume that the sample has been randomly selected from a population with a
normal distribution.
16) A public bus
company official claims that the mean waiting time for bus number 14 during
peak hours is less than 10 minutes. Karen took bus number 14 during peak hours
on 18 different occasions. Her mean waiting time was ![]() minutes with a standard deviation of
minutes with a standard deviation of ![]() minutes. At the 0.01 significance level, test
the claim that the mean is less than 10 minutes.
minutes. At the 0.01 significance level, test
the claim that the mean is less than 10 minutes.
A) t x > t c , Fail to reject
null.
B) t x < t c , Fail to reject
null.
C) t x > t c , Reject null.
D) t x < t c , Reject null.
E) *Not a choice* additional answer information:
Test statistic: t = ![]() .
Critical values: t = -2.567. Reject
.
Critical values: t = -2.567. Reject ![]() . There
is sufficient evidence to support the claim that the mean is less than 10
minutes.
. There
is sufficient evidence to support the claim that the mean is less than 10
minutes.
Construct a scatter diagram for the given data.
17) ![]()
A)
 B)
B)
C)
 D)
D)
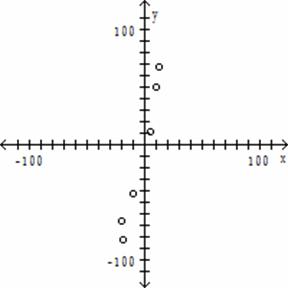
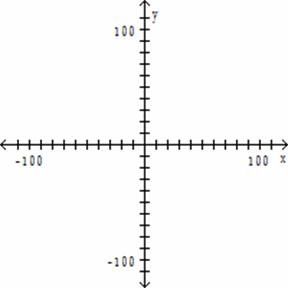
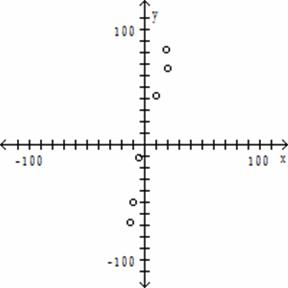
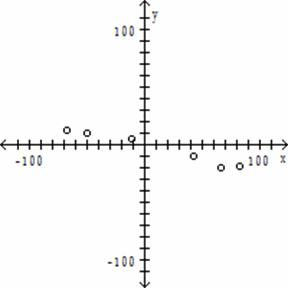
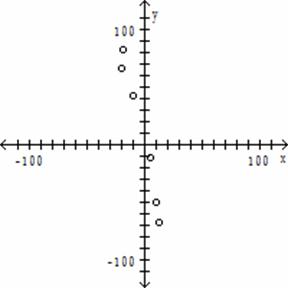
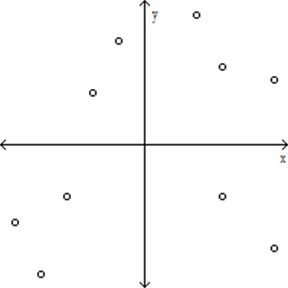
Determine which plot shows the strongest linear correlation.
18)
A)
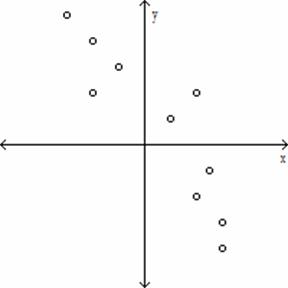
B)
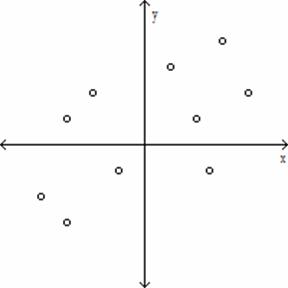
C)
Find the value of the linear correlation coefficient r.
19) A study was conducted to
compare the average time spent in the lab each week versus course grade for
computer students. The results are recorded in the table below.
Number of hours spent in lab Grade (percent)
10 96
11 51
16 62
9 58
7 89
15 81
16 46
10 51
A) -0.284 B) 0.462 C) -0.335 D) 0.017
Given the linear correlation coefficient r and the sample size n,
determine the critical values of r and use your finding to state whether or not
the given r represents a significant linear correlation. Use a significance
level of 0.05.
20) r = ![]() , n = 25
, n = 25
A) Critical values: r = \'B10.396, significant linear
correlation
B) Critical values: r = \'B10.396, no significant linear
correlation
C) Critical values: r = \'B10.487, no significant linear
correlation
D) Critical values: r = \'B10.487, significant linear
correlation
MULTIPLE CHOICE. Choose the one
alternative that best completes the statement or answers the question.
1) D
ID: STAT9T
7.2.2-3
Page Ref:
373-374
Objective:
(7.2) Identify Null and Alternative Hypotheses
2) A
ID: STAT9T
7.2.6-3+
Page Ref:
376-381
Objective:
(7.2) Formulate Conclusion of Hypothesis Test
3) B
ID: STAT9T
7.2.3-5
Page Ref:
374-375
Objective:
(7.2) Find Critical z Value
4) B
ID: STAT9T
7.2.4-1
Page Ref:
374-375
Objective:
(7.2) Find Test Statistic
5) C
ID: STAT9T
7.3.2-1+
Page Ref:
391-392
Objective:
(7.3) Find P-Value
6) A
ID: STAT9T
7.3.1-3+
Page Ref:
389-391
Objective:
(7.3) Test Claim About Proportion
7) D
ID: STAT8T
7.2.2-6
Page Ref:
369-371
Objective:
(7.2) Identify Null and Alternative Hypotheses
8) B
ID: STAT8T
7.2.4-6+
Page Ref:
374-375
Objective:
(7.2) Formulate Conclusion of Hypothesis Test
9) B
ID: STAT8T
7.2.5-6
Page Ref:
375-376
Objective:
(7.2) Identify Type I/Type II Error
10) D
ID: STAT8T
7.4.1-8
Page Ref:
400-403
Objective:
(7.4) Find Critical t Value
11) D
ID: USER-1
Page Ref:
Objective:
12) D
ID: STAT8T
7.4.4-2+
Page Ref:
401-403
Objective:
(7.4) Find Decision Rule for Traditional Test
13) C
ID: STAT8T
7.4.5-7
Page Ref:
401-403
Objective:
(7.4) Compute Test Statistic for Traditional Test
14) C
ID: STAT9T
7.5.1-1
Page Ref:
408-414
Objective:
(7.5) Use Correct Distribution
15) C
ID: STAT9T
7.5.2-1+
Page Ref:
408-414
Objective:
(7.5) Find Test Components
16) D
ID: STAT9T
7.5.3-6+
Page Ref:
408-414
Objective:
(7.5) Test Hypothesis
17) C
ID: STAT9T
9.2.2-2
Page Ref:
496-498
Objective:
(9.2) Construct Scatter Plot
18) A
ID: STAT9T
9.2.3-2
Page Ref:
496-498
Objective:
(9.2) Interpret Scatter Plot
19) C
ID: STAT9T
9.2.4-7
Page Ref:
499-503
Objective:
(9.2) Find Linear Correlation Coefficient
20) A
ID: STAT9T
9.2.1-1
Page Ref:
496-498
Objective:
(9.2) Test for Linear Correlation